Most of the investors who use Ea now use it directly after downloading the EA, regardless of the Ea strategy and the advantages and disadvantages.
BangEa has always been advocating that everyone should fully understand an EA strategy before using it, so as to understand the market under which this Ea works better, and under which market the effect may not work. We do not recommend that you use black box EA.
Only by fully understanding the strategy of an EA can you know whether it is profit or loss.
BangEa’s EA will tell you the strategy, but even if the website’s introduction has already said that it is clear, you may still not have an intuitive feeling about this EA before trading dozens of transactions.
The following tutorial is to teach you how to use historical data for backtesting, so that you can conduct hundreds of thousands of transactions in a short period of time, and you can quickly understand the strategies, advantages and disadvantages of an Ea.
1.Download and install Ea first, if you can’t install it, please go here:https://bangea.com/wp-admin/post.php?post=299&action=edit
2.Download historical data:
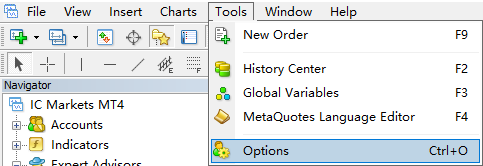
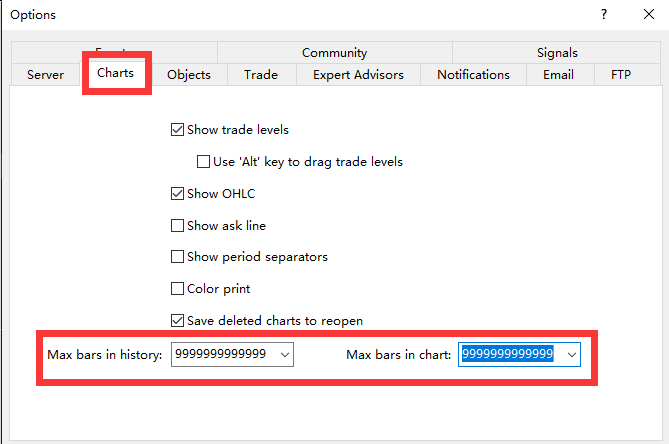
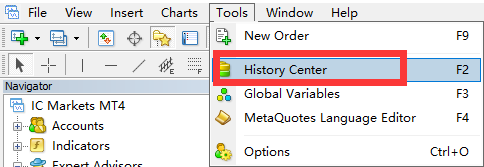
After the input is complete, click “OK”, and then restart MT4. After restarting, enter “Tools”, “History Center”.
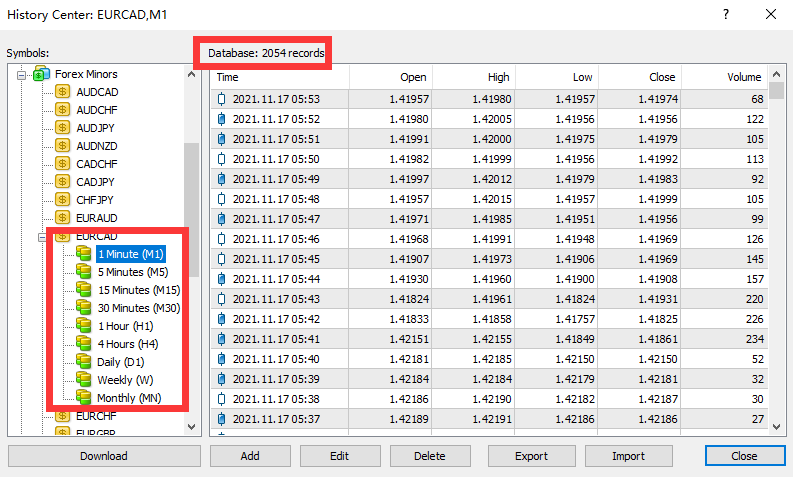
I want to download the data of EURCAD, find EURCAD in the symbols on the left, double click “M1 M5-all the way to-MN” to turn the small icons in front of all the time charts into yellow Green color.
Click the “download” button, and you can see that the 1 minute data in the database is 2054 records.
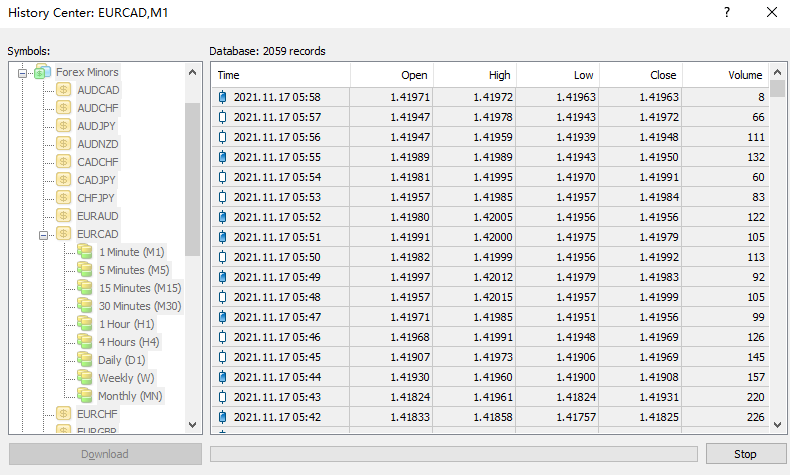
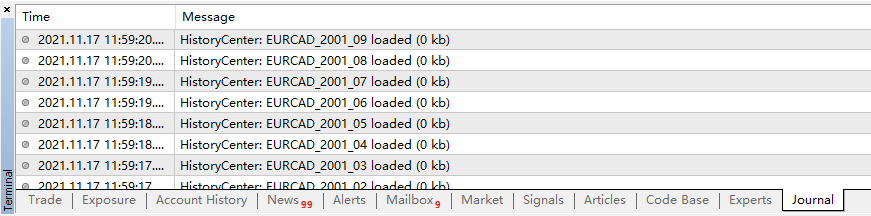
After clicking download, the download button will turn gray. You can see in the log that the data has been downloaded.
If the download button changes from gray to clickable state, it means that the download has stopped. At this time, click the “Download” button again to continue the download.
3.Use historical data to return
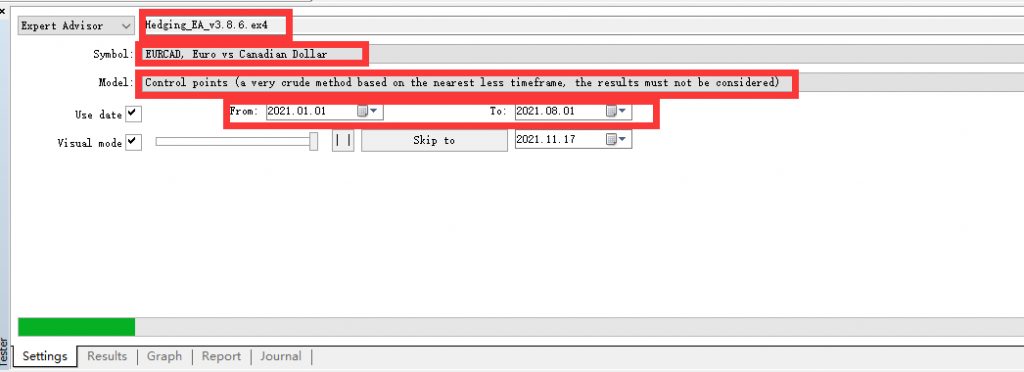
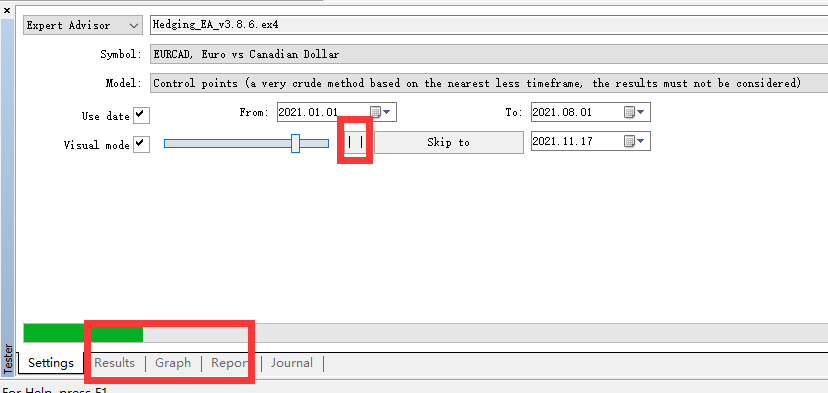
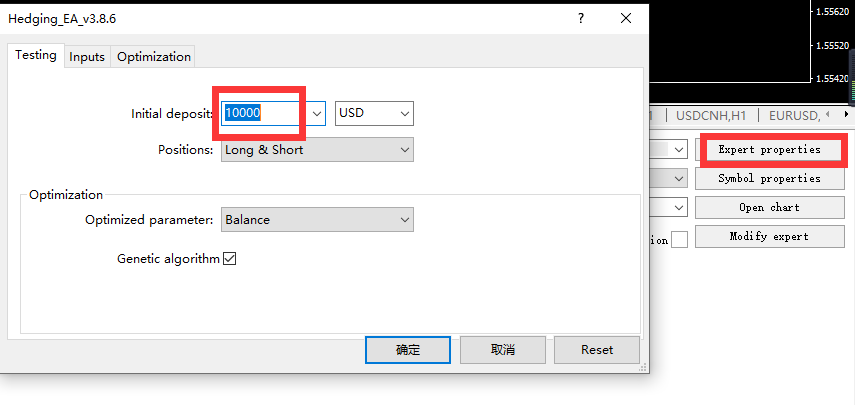
Select the Ea of the Stratage Tester, set the Symbol, check the date, and set Use date, check the retest display, select the time period, and set the spread.
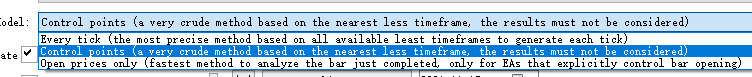
You can basically see and understand the settings. The only thing that may not be clear is the ” model”. There are three options for the review model, namely “every tick”, “control point”, and “open prices only”.
every price probably means using the most accurate price for back-testing, but the speed is also the slowest, only the opening price is the fastest back-testing, but the data is used less, the result may not be accurate, and the control points are at two In the middle, the control point means that 12 points are randomly selected on a candlestick for backtesting. The opening price is only 4 prices for each candlestick’s high to open and low to close, and each real-time price is recorded with data. Back-testing of all prices. You can choose this choice according to your computer’s computing power. I usually use control points for backtesting.
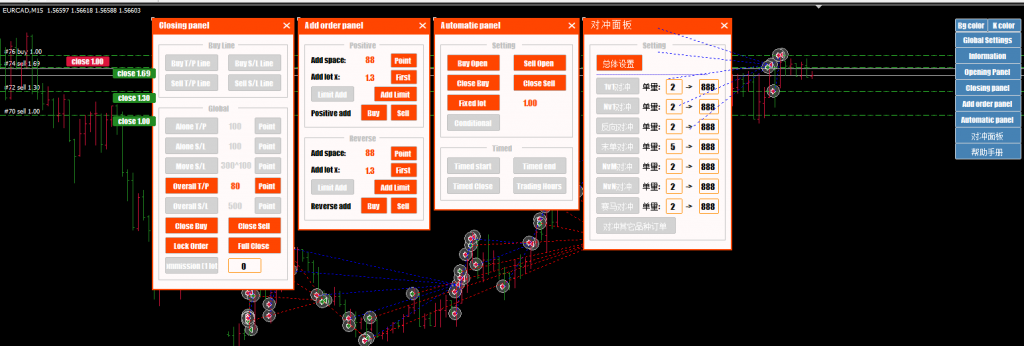
After setting, click “Start”, and the chart will scroll to the left quickly under normal circumstances. The time is of course the backtest time we set above.
During the back test, you can control the Ea back test speed and pause the back test through the slider and button below.
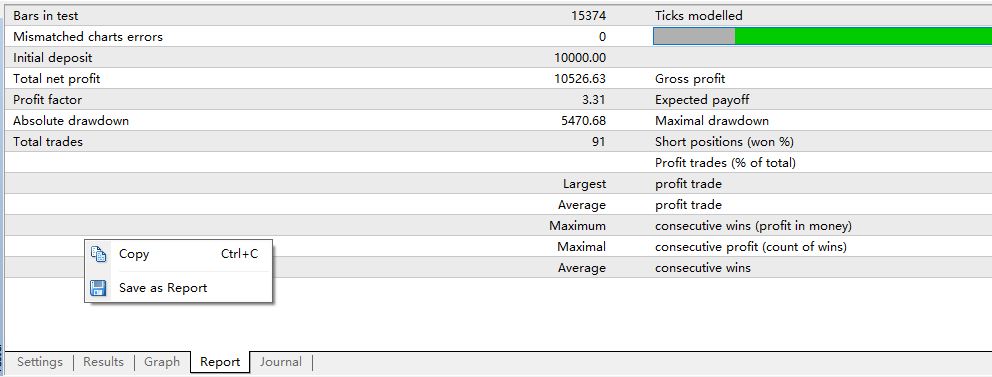
Check the transaction results by clicking on the “Results”, “Equity Graph”, and “Reports” below.
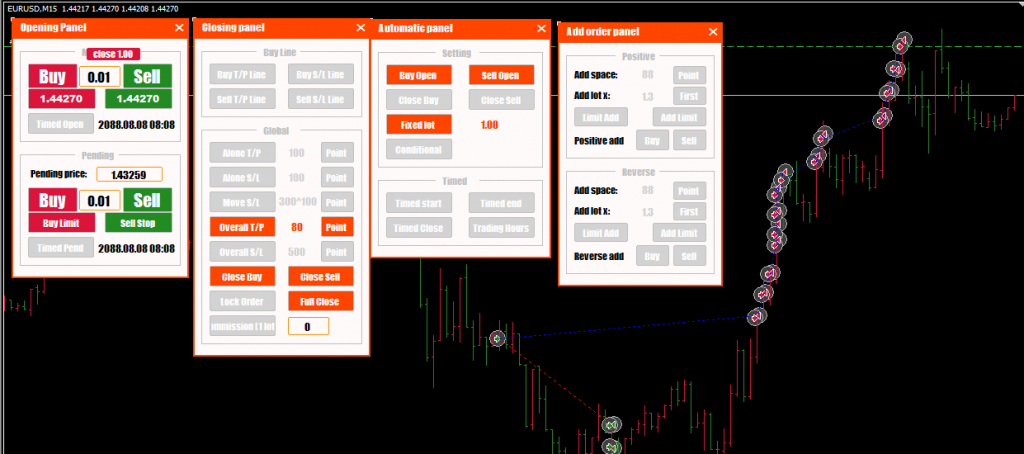
Set the stratage on the panel
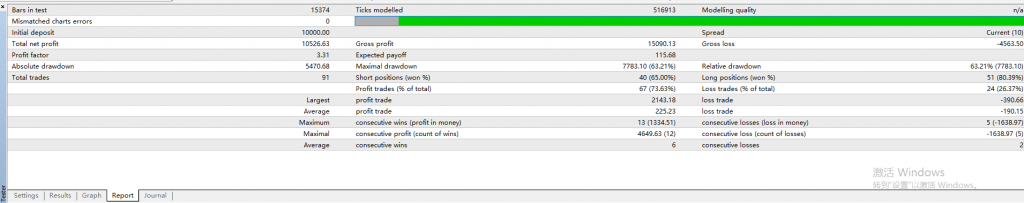
Right-click in the report and select “Save report”, a web file report will be generated.
4.Modify Stratage Tester
Regarding the functions on the EA panel, we write a help manual.