The difference mainly comes from the bar shape in different fixe d periods.
As shown in the figure below, such as the 1-minute chart and the daily chart, many K-lines in the 1-minute chart may have only a small number of TICKs. During the inactive time period of some unpopular varieties, the 1-minute K-line fluctuates several times, while the daily chart The daily fluctuations are not too different.
That is to say, the distribution of ticks in the small-period K-line chart is very uneven.
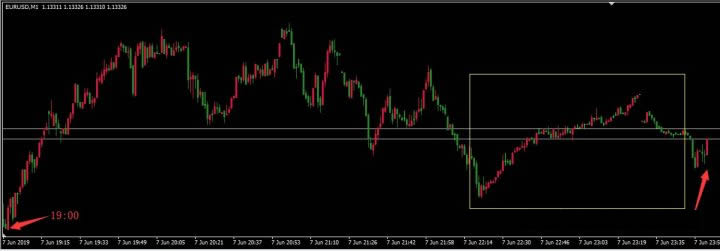
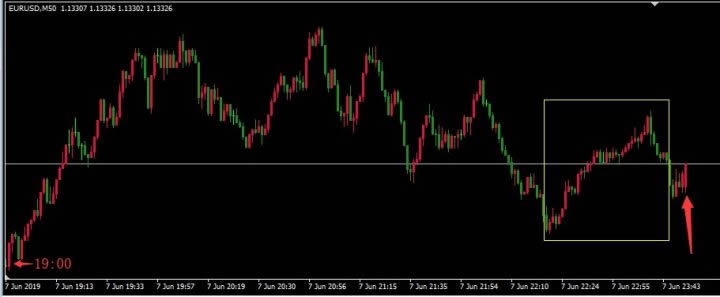
The above two charts are K-line charts of the same time period.
The upper one is a 1-minute K-line chart, and the lower one is a chart that generates a K-line every 50 ticks.
Sometimes the K-lines of the upper and lower charts are similar, but in the inactive time period, the number of K-lines in the tick chart below is less, and the market is clearer.
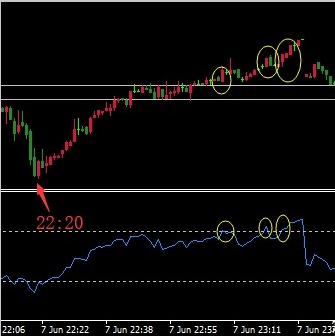
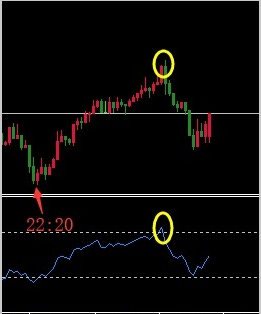
If you are trading with an indicator, the indicator will behave differently on the upper and lower charts.
The following two pictures are the enlarged part of the box above, the same rsi indicator, the same time period, the difference is still obvious.