This is a question raised by a friend in the EA BANG forum.
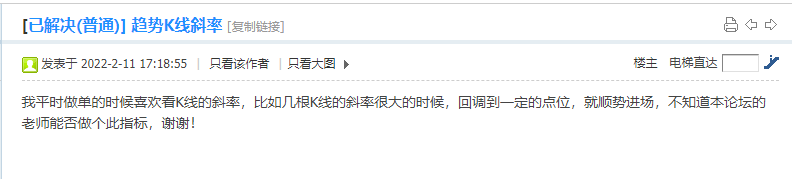
In fact, this function does not need to be made into an indicator, because the existing EA can realize it.
There are two ways to achieve this.
What is the slope of the k-line?
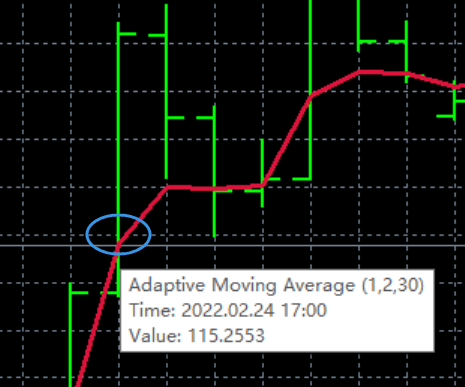
It is a line formed by connecting N consecutive K lines and the closing ends of the two K lines at the head and tail. As shown in the figure:
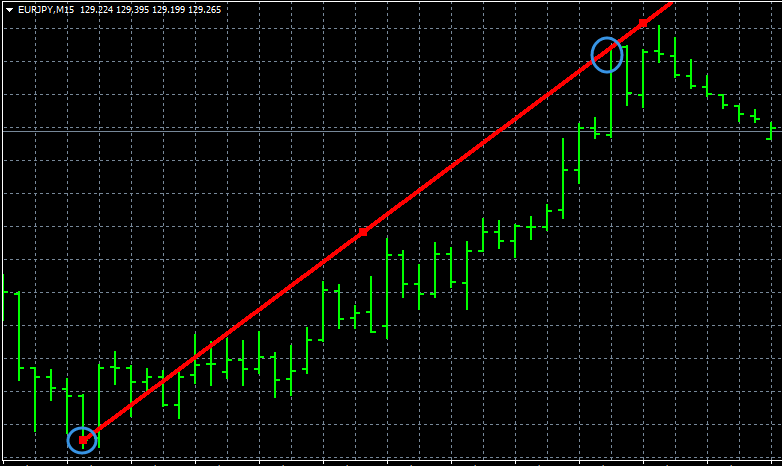
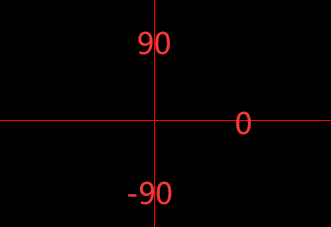
So can the angle value of this slash be calculated?
When the slope is greater than a value, a long order is placed at a fixed point below the current price. When the price goes down to the position of the pending order, the long order will be filled.
Whether its trading strategy works well, let’s not talk about it first, let’s talk about how to achieve the slope of the k-line?
In the automatic panel – conditional opening and closing – moving average, there is a moving average angle to open a position, you may ask, we are talking about the K line angle, how to use the moving average angle?
In fact, the moving average with a K-line is the K-line. As shown in the figure below, a simple moving average with a call period of 1 is applied to the closing price. It can be seen that the closing price of the moving average and the K-line coincide.
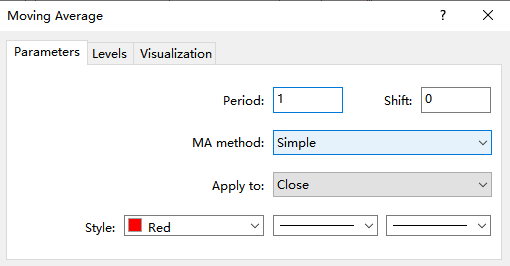
When the mouse is placed at the intersection of the moving average and a certain K line, it can be found that the value of the moving average is the closing value of the K line. Therefore, we only need to set the K line as a moving average to calculate the angle of the moving average.
1.As shown in the figure below, you can open positions at the K-line angle.
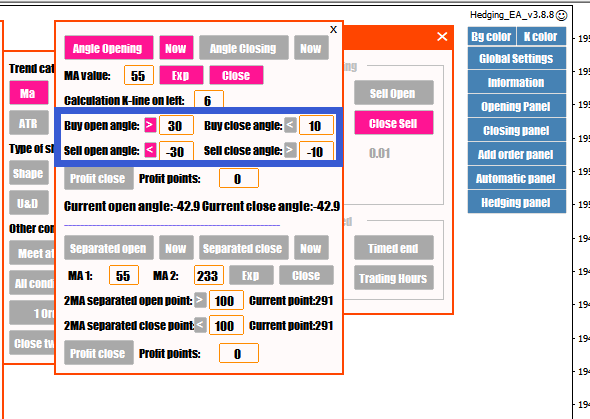
How is the value of the angle defined? The default is to calculate the angle from the closing price of the previous 6th K-line to the current price.
2.But the strategy mentioned by this friend may also be another way. It is a K-line that fluctuates up or down by one point, and then places the order. So how to use HedgingEA to achieve it?
Here we will use the automatic panel – conditional opening and closing, the yin and yang inside.
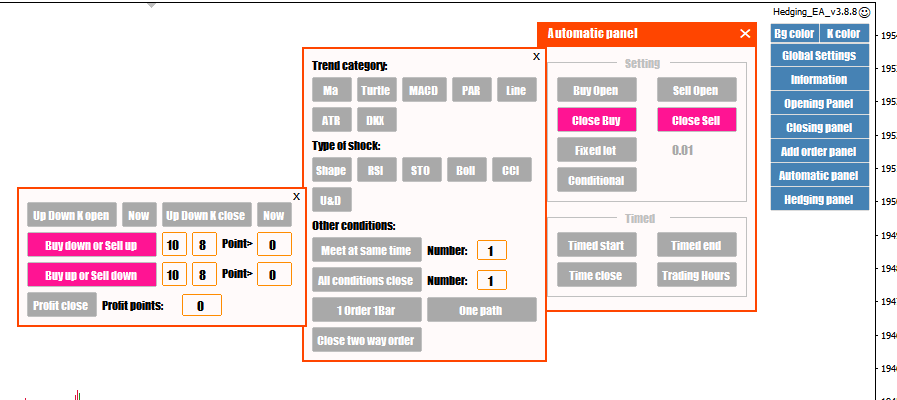
The above picture shows: 8 of the previous 10 K lines are positive lines, and the number of points between the high and low points is greater than the number of points (you can set it yourself in the above picture), and then go to the pending order.
It can be done in two ways.
Finally, let’s talk about the precautions. Angle trading is related to the resolution of our chart and display. If the density of my chart is smaller, its angle may become larger. If the density is larger, its angle will be Possibly smaller.